harry-sicily
🌪️ Harry Cyclone Social Contents Viewer
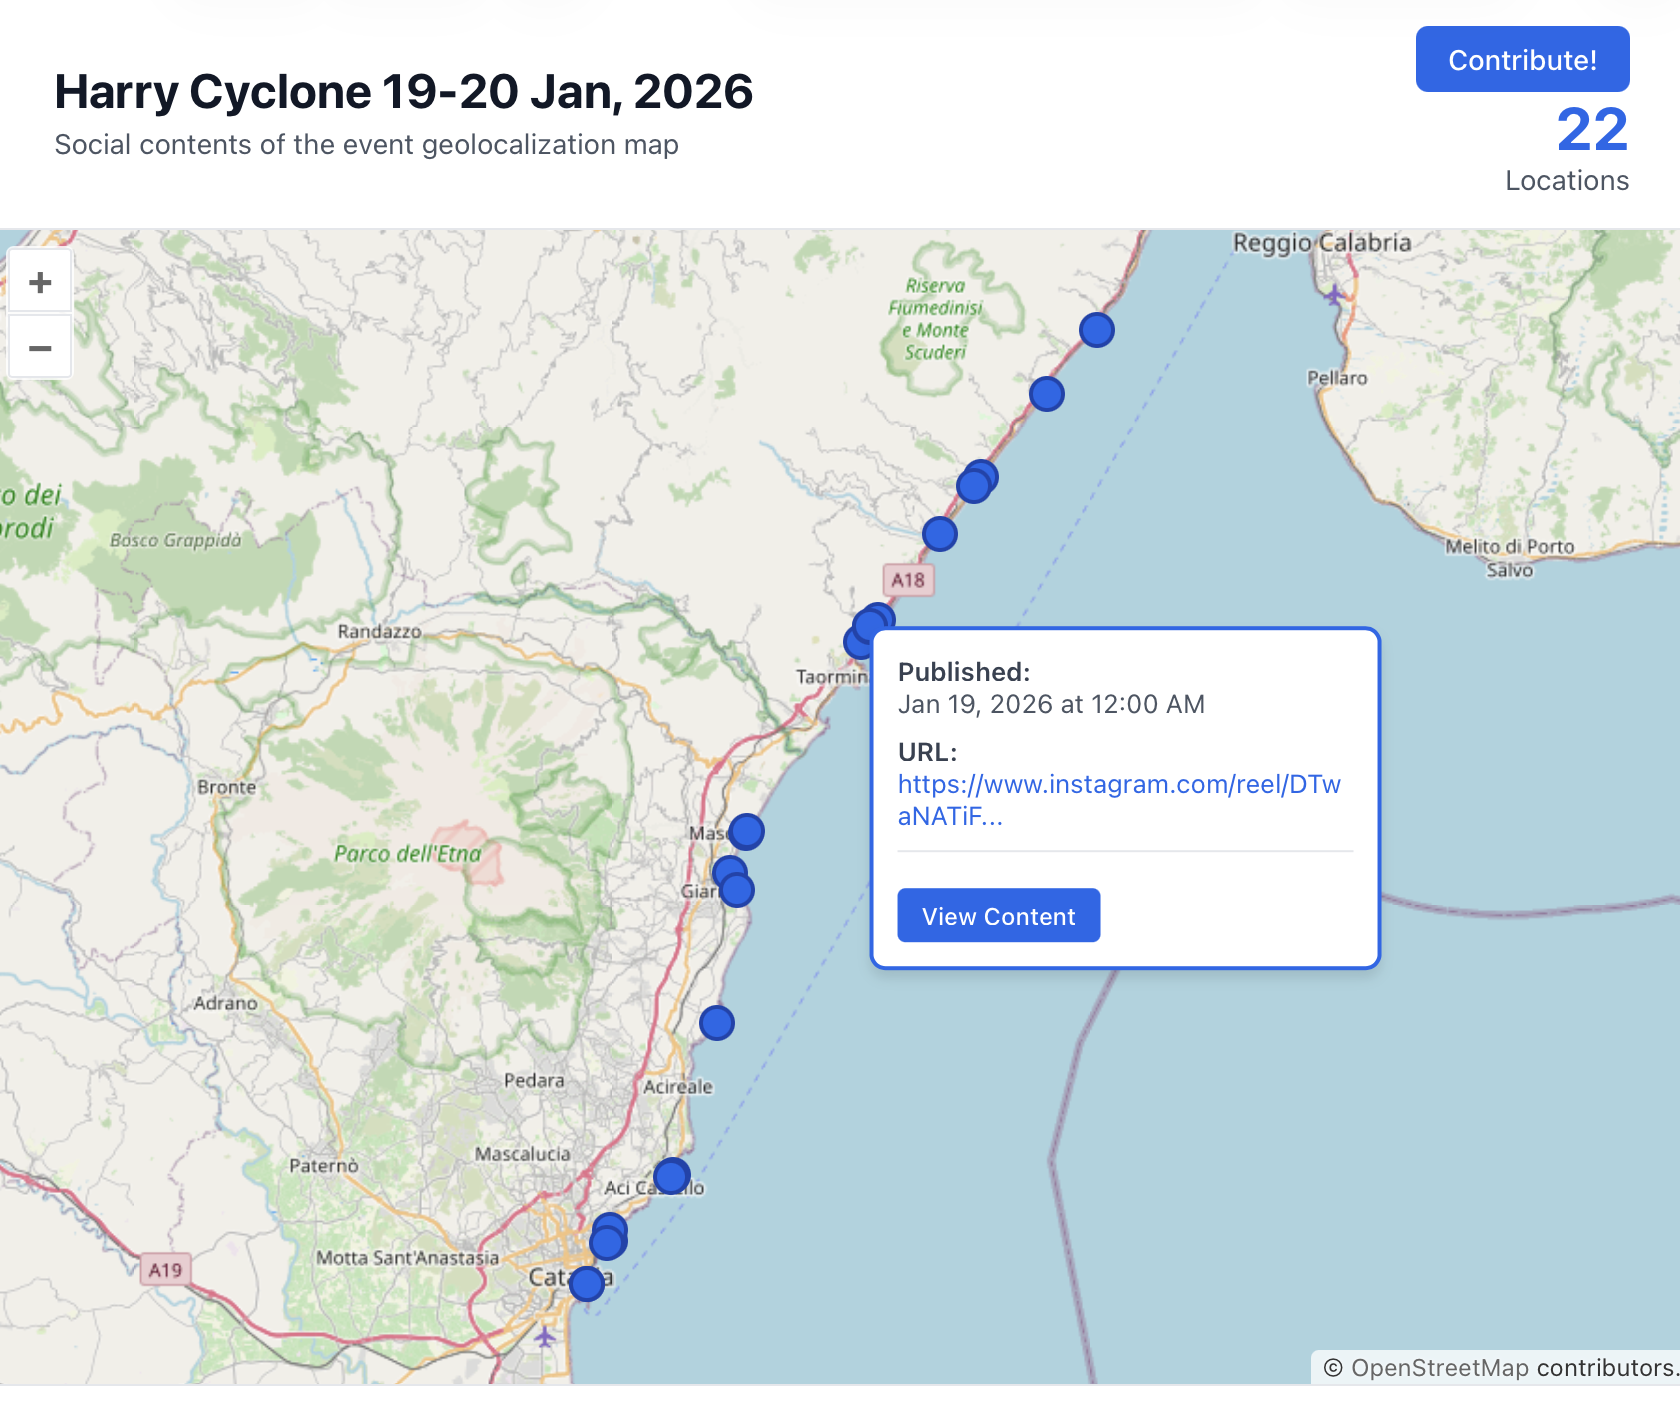
Event Date: January 19-20, 2026
Location: Ionian Coast
GO to the map!
A collaborative WebGIS project designed to map and visualize social media testimonials (videos, photos, posts) regarding the “Harry Cyclone” event.
🎯 General Objectives
The main goal of this project is to collect and geolocate evidence of the cyclone that hit the Ionian coast. By aggregating content from social networks (Facebook, Instagram, etc.) onto a single map, we aim to:
-
Create a visual timeline and spatial distribution of the event.
-
Preserve digital testimonies of the weather impact.
-
Provide an open-source dataset for analysis or documentation.
🚀 How to Contribute
We welcome contributions from the community! You can contribute by adding new data points (social media links) or by improving the website code.
📍 Contributing Data (GeoJSON)
If you have found a social media post relevant to the event, please follow these steps to add it to the map using QGIS:
- Fork and Clone the repository to your local machine:
git clone https://github.com/gianfrancodp/harry-sicily - Open the Data:
- Launch QGIS.
- Drag and drop the
social_contents.geojsonfile into the QGIS window.
- Add a Location:
- Toggle Editing mode (click the pencil icon ✏️).
- Select the Add Point Feature tool.
- Click on the map where the video/photo was taken.
- Fill Attributes:
When you click on the map, a form will appear. Please fill in the following fields:
pkuid: Assign a unique integer ID (increment the last known ID).URL: The full link to the social media post (e.g., Facebook Reel, Instagram Video).Data_pubblicazione_URL: The date/time of the post in ISO format (e.g.,2026-01-20T16:59:30).note: (Optional) Brief description or credits (e.g., “Photo by ANSA”).
- Save Changes:
- Save layer edits and toggle editing off.
- Important: Ensure you export/save specifically as
GeoJSONformat, overwriting the original file.
- Submit:
- Commit the updated
social_contents.geojsonfile. - Push to your fork and open a Pull Request.
- Commit the updated
💻 Contributing to the Code
We are also open to improvements for the visualization interface! The project uses:
- HTML5 / CSS3
- OpenLayers v10.7.0 (JS Library)
If you want to improve the UI, add filters, or fix bugs:
- Edit
home.html. - Test your changes locally.
- Submit a Pull Request describing your changes.
🛠️ How to Run Locally
To view the map on your computer, you cannot simply double-click home.html because browsers block loading local external files (CORS policy). You need a simple local server.
Do you like Python?
# Run this command in the project folder
python3 -m http.server
# Then open http://localhost:8000/home.html in your browser